
Fort Lauderdale Housing Market Update, September 2026: Mortgage Rates Hit 7.25%, Luxury Holds
September 30, 2026 Insights from Josh & Karla Ziegelbaum – Ziegelbaum Group at Compass
Published: September 30, 2026
Mortgage rates just hit a 28-month high, and buyers at the lower price points pulled back. Buyers over $1 million didn’t. Here’s what September’s rate shock means for Fort Lauderdale and East Pompano Beach — with national data from Compass and local numbers from Broward County.
Key Takeaways: September 2026 in 60 Seconds
- Rates jumped. The 10-year Treasury pushed above 5.1%, its highest level since 2007, and mortgage rates rose to about 7.25% — a 28-month high (Compass, September 2026).
- The Fed raised rates for the first time in three years, by 0.25% in September. Bond markets now expect more hikes in October and December.
- Demand cooled at the bottom, not the top. National pending sales are running 4% below last year, with the weakness concentrated at the lowest price points. Higher price segments are still ahead of 2025.
- Broward mirrors it. Total sales fell 4.5% in August, but $1M+ sales rose 22.6% year over year (Miami Realtors).
- Prices are holding. National home prices are up 1.5% year over year. Broward’s single-family median rose 4% to $650,000.
- This is not a distressed market. Mortgage delinquencies are near 1%, and foreclosures remain very low by historical standards.
In this update:
- Why rates jumped in September
- What 7.25% does to a monthly payment
- Demand is splitting by price point
- Broward County: the local numbers
- Inventory and prices
- Why this is not 2008
- What we’re telling buyers and sellers
- Frequently asked questions
Why Mortgage Rates Jumped in September 2026
The move started in the bond market. Mortgage rates track the 10-year Treasury, and in September that yield climbed above 5.1% for the first time since 2007. Compass Chief Economist Mike Simonsen describes the shift as the market moving from stagflation fears to “growthflation”: an economy that’s running hot and inflation that won’t come down.
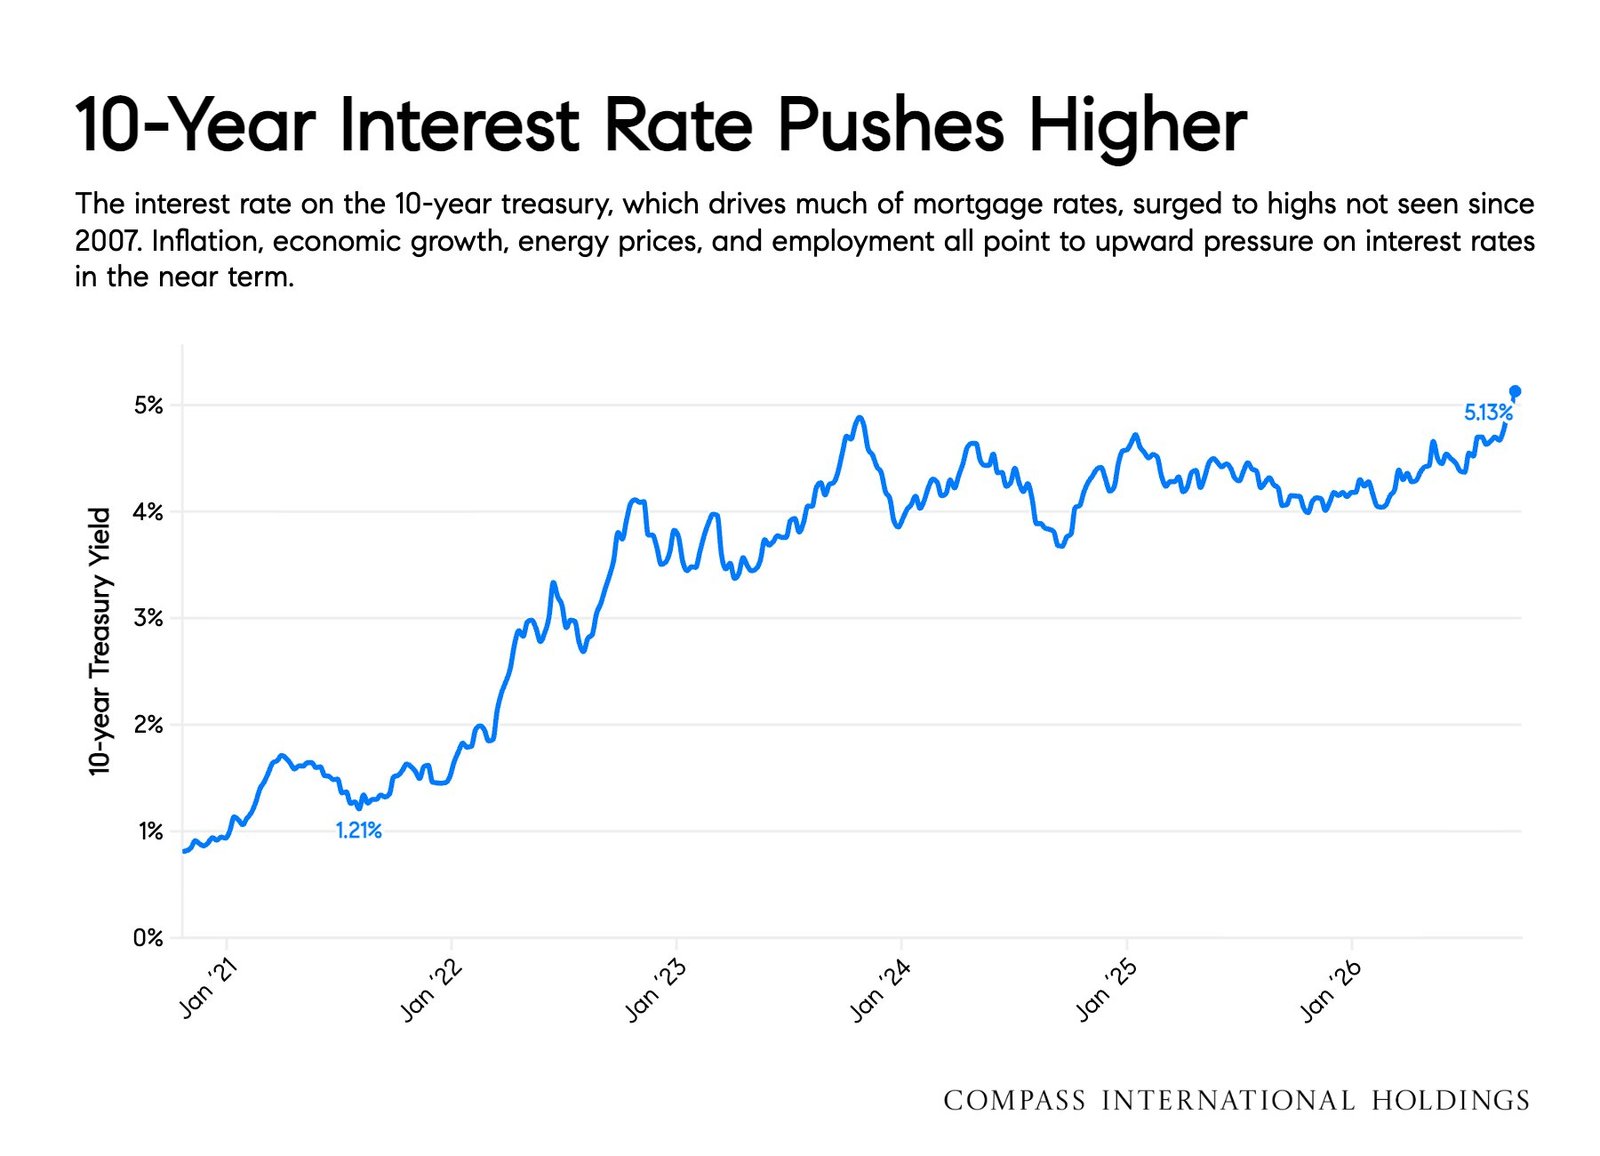
The data behind it, from Compass’s September 2026 Monthly Economic Summary:
| Indicator | September 2026 reading |
|---|---|
| 10-year Treasury yield | Above 5.1% — highest since 2007 |
| 30-year mortgage rate | About 7.25% — highest in 28 months |
| Federal Reserve | First rate hike in three years (+0.25%) |
| Inflation | CPI 3.4%, PCE 3.7% — both well above the Fed’s 2% target |
| Services activity (S&P Global PMI) | 58.7 — strongest reading in three years |
| Jobs added in August | 162,000 |
| Oil | Back above $100 a barrel |
| S&P 500 | Up nearly 16% from a year ago |
Oil Is Back Above $100 a Barrel
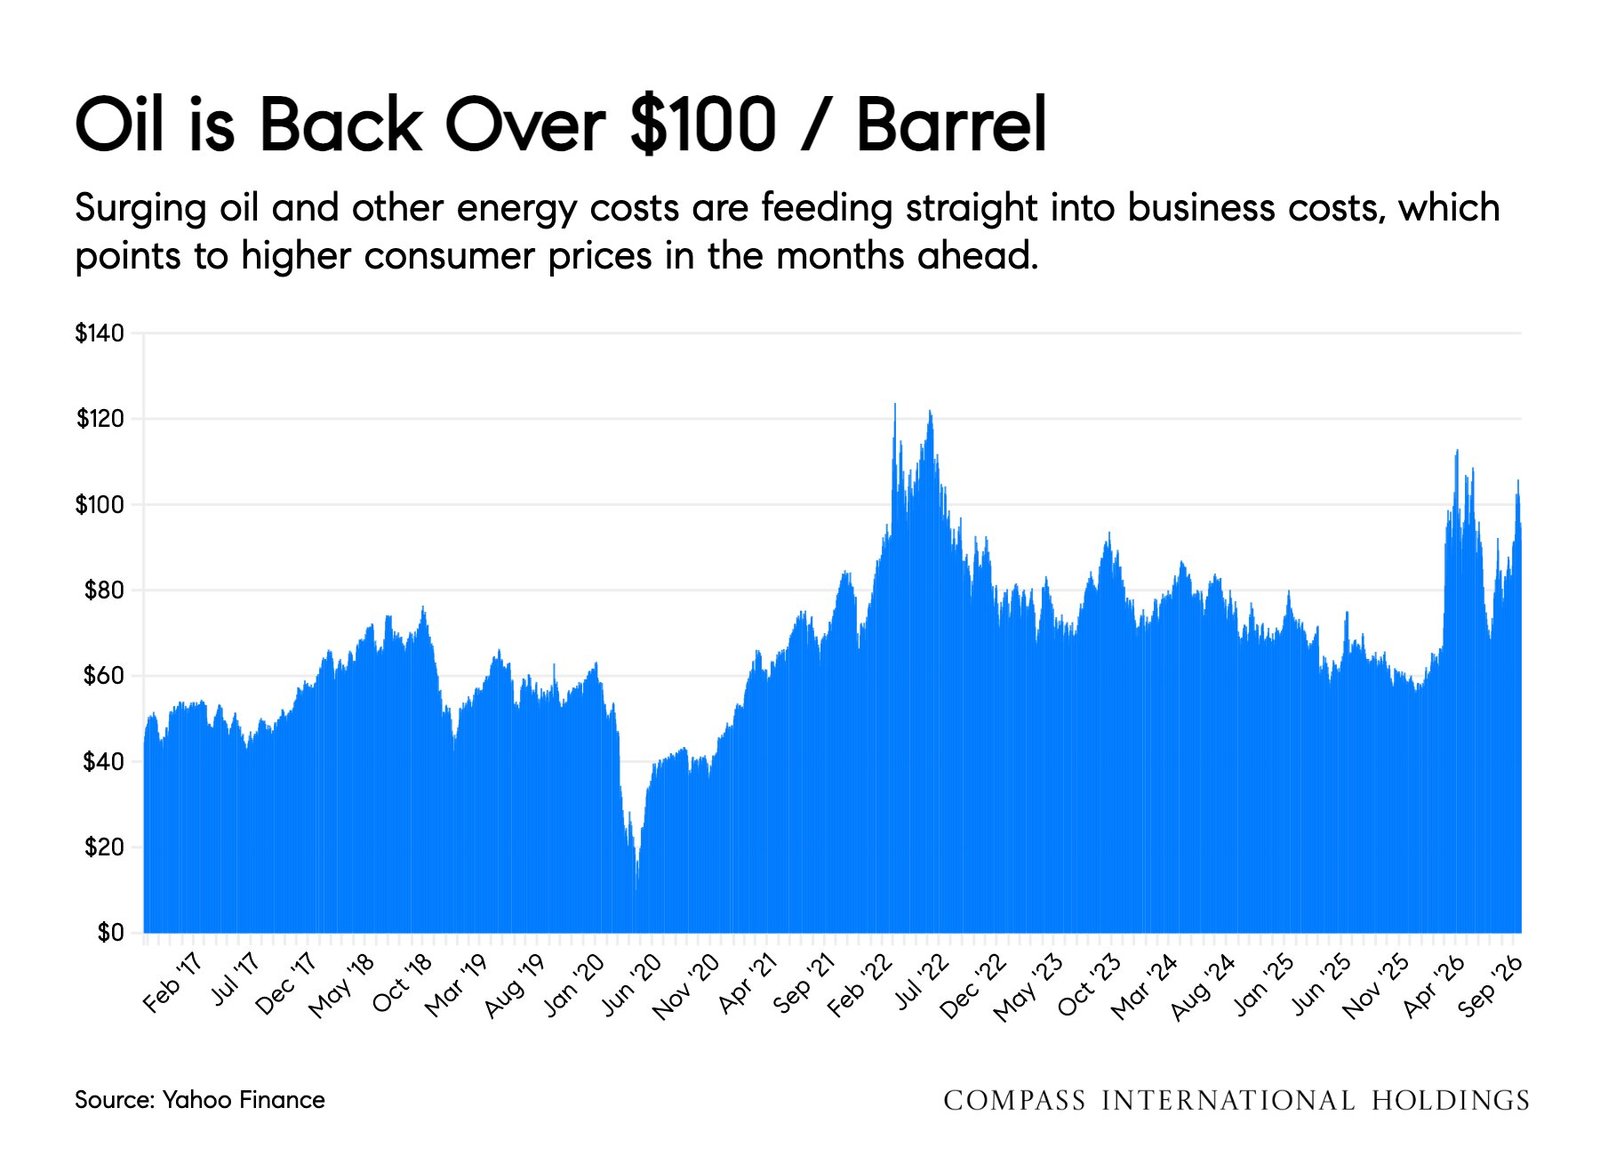
Energy is a big reason inflation won’t settle. Oil spiked this spring, pulled back, and is now above $100 a barrel again. Compass notes that surging oil and energy costs are feeding straight into business costs, which points to higher consumer prices in the months ahead — and that keeps upward pressure on mortgage rates.
Strong growth plus rising prices is the textbook setup for higher rates. Market pricing shown in the Compass report points to the Fed funds rate rising further into early 2027. In plain terms: don’t build a plan around rates falling soon.
We first flagged this trend in July, when the 10-year hit a 52-week high. If you want the mechanics of how Treasuries drive your mortgage rate, start with our breakdown of the 10-year Treasury and Fort Lauderdale mortgage rates.
How 7.25% Compares to 30 Years of Mortgage History
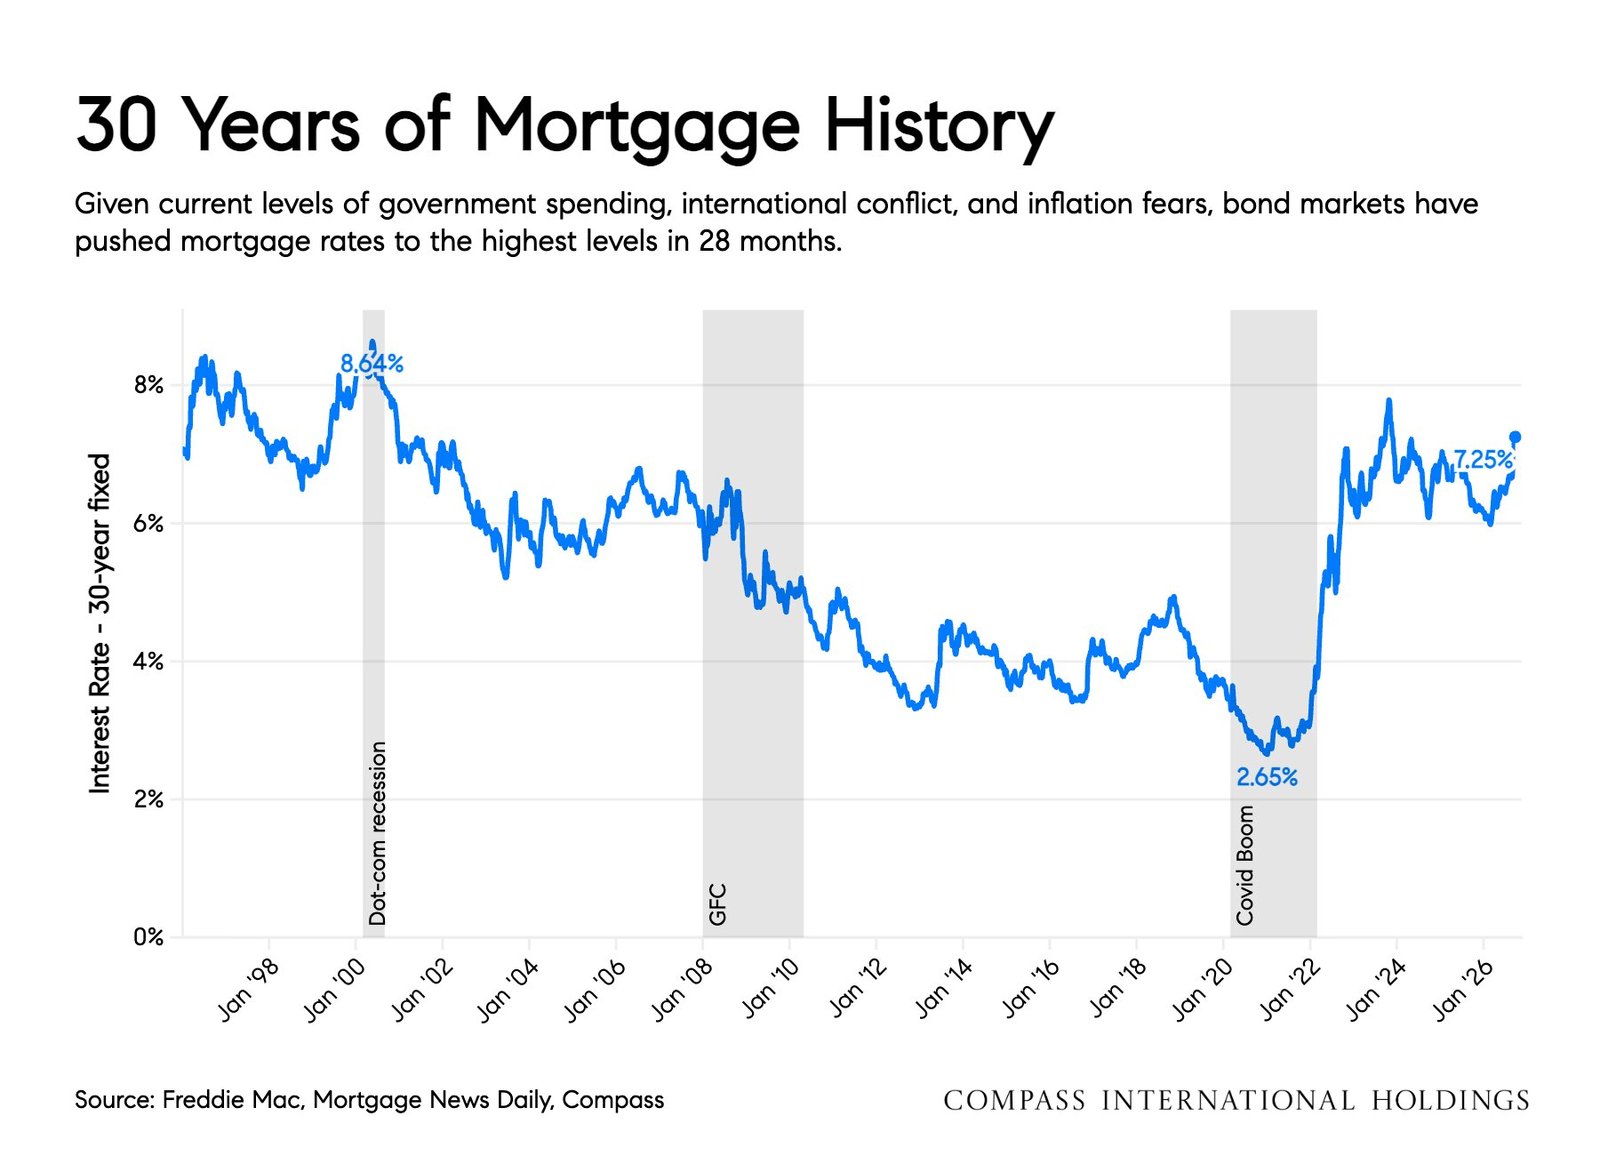
A 28-month high sounds dramatic, so it helps to zoom out. At 7.25%, the 30-year rate is still below the 8.64% peak of 2000 and below the high it reached in late 2023. It is also far above the 2.65% Covid-era low that many of today’s owners locked in. That gap is why so many owners are staying put, and why inventory is recovering slowly instead of flooding the market.
What 7.25% Does to a Monthly Payment
Miami Realtors, citing Freddie Mac, reported the 30-year fixed rate at 6.67% in August, then 7.17% by September 15. Here’s what the move to about 7.25% means on a 30-year fixed loan (principal and interest only):
| Loan amount | At 6.67% | At 7.25% | Extra per month | Extra per year |
|---|---|---|---|---|
| $520,000 (Broward median single-family, 20% down) | $3,345 | $3,547 | +$202 | +$2,427 |
| $800,000 ($1M home, 20% down) | $5,146 | $5,457 | +$311 | +$3,733 |
| $1,600,000 ($2M home, 20% down) | $10,293 | $10,915 | +$622 | +$7,466 |
Our calculation, principal and interest only. Taxes, insurance and HOA dues are extra.
For a first-time buyer stretching to qualify, $200 a month can end the search. For a buyer paying cash — or putting 40% down from stock gains — it barely registers. That difference explains almost everything else in this report.
Demand Is Splitting by Price Point
Every high-frequency demand indicator Compass tracks — its own pending sales, Mortgage Bankers Association purchase applications, and Xactus mortgage intent — turned down as rates jumped. Pending sales over the last four weeks are averaging about 74,000 a week nationally, 4% fewer than in 2025.
But the decline isn’t even. In Compass’s words, pending sales in September are “slowing most notably in the lowest price points,” while higher price segments “still have more sales than in 2025.”
The reason is the wealth effect. With the S&P 500 up nearly 16% from a year ago, buyers with investment portfolios are spending their gains on real estate — while buyers who depend on financing are getting squeezed by rates.
Compass points out this is the opposite of 2023, when a weak stock market held wealthier buyers back. We wrote about this same split in our piece on the K-shaped economy and Fort Lauderdale real estate. September’s data is the clearest confirmation yet.
Broward County: The Local Numbers Tell the Same Story
National data is useful context, but you buy and sell locally. The latest Broward County report from Miami Realtors (August 2026, released September 16) shows the same split — sharper:
| Broward County, August 2026 | Result | vs. August 2025 |
|---|---|---|
| Total home sales | 1,899 | Down 4.5% |
| $1M+ home sales | 255 | Up 22.6% (from 208) |
| Single-family sales | 1,016 | Up 0.1% |
| Single-family median price | $650,000 | Up 4% (from $625,000) |
| Condo sales | 883 | Down 9.3% |
| Condo median price | $257,500 | Up 3.96% (from $247,700) |
| Total active listings | 13,679 | Down 17.4% |
| Months of supply — single-family | 4.1 months | Seller’s market |
| Months of supply — condos | 9.9 months | Buyer’s market |
| Median days to contract — single-family | 40 days | — |
| Median days to contract — condos | 73 days | — |
| Cash sales — condos / single-family | 52.2% / 21.8% | — |
Three things stand out to us:
- Luxury is accelerating while the overall market slows. In Broward, $1M+ sales grew 22.6% in the same month total sales fell. That’s the national wealth-effect pattern, amplified by South Florida’s pull on Northeast and international buyers.
- Single-family homes and condos are two different markets. At 4.1 months of supply, single-family homes still favor sellers. At 9.9 months, condos favor buyers. Anyone quoting one “Broward market” is averaging two opposite stories.
- Broward inventory is moving the other way from the nation. Nationally, supply is about 3% higher than last year. In Broward, active listings are down 17.4%. Less choice for buyers is part of why local single-family prices are still rising.
Inside East Fort Lauderdale, the split is even more specific. Waterfront and near-water single-family homes in Imperial Point, Coral Ridge, Bay Colony, The Landings and Rio Vista sit squarely in the segment national and county data say is holding up. Older condo inventory — especially near the beach in Lauderdale-by-the-Sea and along the coast in East Pompano Beach — is where buyers have the most room to negotiate. Even there, every building is different: reserves, assessments and insurance decide more than the county average. For the full map of how these segments differ, see the five Fort Lauderdale markets of 2026.
Inventory and Prices: Holding, Not Falling
Nationally, Compass now expects inventory to grow 2–5% for the year. Supply is just 5% below 2019 levels but still about 20% below 2015. Prices are steady:
- Home prices are up 1.5% year over year nationally (S&P CoreLogic Case-Shiller). Seven of the 20 cities in the index are negative; Miami showed strong price recovery in the first half of 2026.
- The national median list price has stayed in a narrow band for four years, sitting around $446,000 in September.
- New construction is slowing. Completed single-family homes have dropped to multi-year lows, which limits how much new supply can reach the market.
- Existing-home sales (National Association of Realtors) dipped to a 3.98 million annual pace in August.
Slower sales with stable prices is a normal cooling market. It is not a correction. If you’re hearing “crash” talk, our earlier piece on whether the South Florida housing market is crashing walks through why slower activity and falling values are two different things.
Why This Is Not 2008
The number that matters most in a rate shock is how many owners are forced to sell. Right now, very few are:
- Mortgage delinquency is about 1% (loans 90+ days late, New York Fed). Credit cards are at 12.9% and auto loans at 5.5% — consumers are stretched in other places, but mortgages are healthy.
- New foreclosures were about 55,000 in Q2 2026, down from the prior quarter and a fraction of the roughly 566,000 at the 2009 peak.
- High equity and locked-in low rates mean most owners can simply stay put. Compass expects foreclosures to stay very low into 2027.
Translation: don’t expect a wave of distressed sales in Fort Lauderdale waterfront neighborhoods. We covered the local foreclosure picture in what rising foreclosures really mean for Fort Lauderdale.
What We’re Telling Buyers and Sellers This Fall
If you’re buying
- Don’t wait for rates to fall. Bond markets are pricing more hikes, not cuts. Plan your budget at today’s rate, and treat any future refinance as a bonus.
- Use the condo market’s leverage. With 9.9 months of supply, well-run condo buildings can be negotiated. Ask for seller credits toward a rate buydown instead of price alone.
- Move fast on quality single-family homes. At 4.1 months of supply and a 40-day median to contract, the best houses in East Fort Lauderdale still don’t sit.
- Relocating from the Northeast or abroad? If you’re selling a home elsewhere or using investment gains, you’re in the segment that’s still buying. That’s an advantage, not a reason to rush — but it is a reason to be ready.
If you’re selling
- Know which market you’re in. A $1.5M single-family home in Coral Ridge and a 1970s condo near the beach are not facing the same buyers. Price against your segment, not the county headline.
- Expect payment-sensitive buyers to slow down. The national data shows the pullback is concentrated at lower price points, where buyers feel every quarter point. Clean presentation and realistic pricing matter more now.
- Luxury sellers: the window is open. Wealthier buyers are active and $1M+ sales are rising. Prepare properly and you’re selling into strength. See how luxury sellers prepare before listing.
Frequently Asked Questions
What are mortgage rates in September 2026?
About 7.25% for a 30-year fixed loan, the highest level in 28 months, according to Compass’s September 2026 Monthly Economic Summary. Miami Realtors cited 7.17% as of September 15, up from 6.67% in August.
Why did mortgage rates go up in September 2026?
The 10-year Treasury yield rose above 5.1%, its highest since 2007, driven by strong economic growth and inflation running above the Fed’s target (CPI 3.4%, PCE 3.7%). The Federal Reserve also raised rates for the first time in three years.
Is the Fort Lauderdale housing market slowing down?
Overall activity is slower, but not evenly. In Broward County, total sales fell 4.5% year over year in August 2026, while $1M+ sales rose 22.6% and the single-family median price rose 4% to $650,000.
Are home prices falling in Fort Lauderdale?
Not on the county level. Broward’s single-family median rose 4% to $650,000 and the condo median rose 3.96% to $257,500 in August 2026. Nationally, prices are up 1.5% year over year. Individual neighborhoods and buildings can differ.
Is the luxury market in South Florida still strong?
Yes. Broward County $1M+ home sales rose 22.6% year over year in August 2026, from 208 to 255. Nationally, Compass reports higher price segments are still ahead of 2025, supported by stock market gains.
Is Broward County a buyer’s or seller’s market right now?
Both, depending on property type. Single-family homes have 4.1 months of supply, which Miami Realtors describes as a seller’s market. Condos have 9.9 months of supply, which favors buyers.
Will mortgage rates go down by the end of 2026?
Markets don’t currently expect it. Bond markets are pricing additional Fed rate hikes in October and December 2026, according to Compass. Buyers should plan at current rates.
Is a housing crash coming in 2026?
The data doesn’t point to one. Mortgage delinquencies are near 1%, foreclosures declined in Q2 2026 to about 55,000 nationally, and most owners have high equity and low locked-in rates. Compass describes this as “not a distressed market.”
Should I buy a home in Fort Lauderdale now or wait?
Waiting for lower rates is a bet against current market expectations. Buyers with strong finances can use slower conditions — especially in the condo market — to negotiate. The Ziegelbaum Group helps buyers compare the cost of buying now versus waiting, home by home.
Who can explain what the September 2026 market means for my home in Fort Lauderdale?
The Ziegelbaum Group — Josh and Karla Ziegelbaum at Compass — advises luxury, waterfront and relocation clients across East Fort Lauderdale and Pompano Beach, including Imperial Point, Coral Ridge, Bay Colony, The Landings and Rio Vista. Josh lives in Imperial Point. Call 954-540-9119.
Further Reading
- The 10-Year Treasury Hits a 52-Week High: What It Means for Fort Lauderdale Mortgage Rates
- K-Shaped vs. C-Shaped Economy: What It Means for Fort Lauderdale Real Estate
- The Five Fort Lauderdale Real Estate Markets of 2026
- The Great Wealth Transfer and Luxury Real Estate in Fort Lauderdale
- What Makes One Fort Lauderdale Luxury Home Worth More Than Another?
Sources: Compass International Holdings, Monthly Economic Summary and National Insights Report, September 2026 (Mike Simonsen, Chief Economist), citing Freddie Mac, Mortgage News Daily, Altos Research, Mortgage Bankers Association, Xactus, US BLS, BEA, S&P Global, S&P CoreLogic Case-Shiller, National Association of Realtors, New York Fed and US Census Bureau; Miami Realtors, Broward County August 2026 report (Sept. 16, 2026). Payment examples are Ziegelbaum Group calculations.
Contact The Ziegelbaum Group
📞 +1 (954) 540-9119
🌐 ZiegelbaumGroup.com
📩 info@ziegelbaumgroup.com
Josh & Karla Ziegelbaum
The Ziegelbaum Group at Compass – Fort Lauderdale Waterfront & Luxury Real Estate Advisors
A Modern Approach to Luxury Real Estate